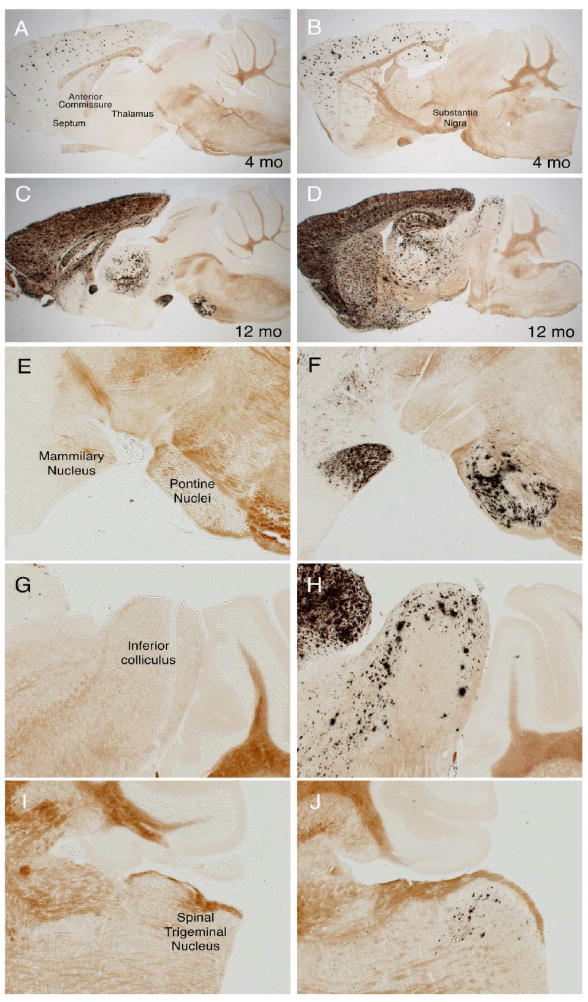
Figure 8.
MR analyses predict unexpected sites of future amyloid formation in mid- and hindbrain structures. A, C, E, G and I. Volumetric MR analyses detect significant loss or diminished growth in multiple structures outside of the neocortex following 4 months of APP overexpression, but at this stage of disease amyloid pathology appears only in the forebrain. B. D, F, H, and J. Much later in the disease (after 12 months of APP overexpression) several regions identified by MR ultimately develop amyloid pathology (arrows in B and D), suggesting that structural alterations occur long before amyloid formation. Because overexpression of transgenic APP is limited to the forebrain, damage to these mid- and hindbrain structures must arise through different connections to rostral structures. All panels show double transgenic APP102/TTA sections stained with Campbell-Switzer silver method for amyloid plaques; animals pictured here were not used for MR imaging. A–D show low magnification images from two different sagittal planes, E–F show higher magnification images of miodbrain structures in A and B; G–J show higher magnification images of mid- and hindbrain structures in C and D.

