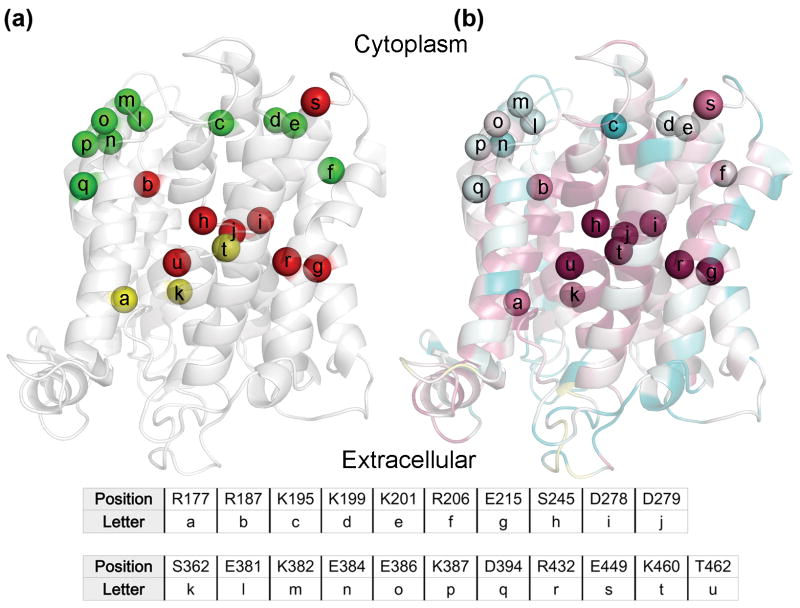
Fig. 6. Mutagenesis results in light of the evolutionary conservation analysis.
In panels (a) and (b), the NHA2 model is shown as transparent ribbons, with its cytoplasmic-facing side up. Cα atoms of mutated positions are shown as spheres, and are marked by lower-case letters with their corresponding residues shown in the table. (a) Residues mutated in this study are colored by the resulting phenotype of the mutations, with red, green and yellow corresponding to non-functional, functional and partially functional. Positions were colored red even if a single mutant failed to rescue the salt-sensitive yeast in the presence of either Li+ or Na+, whereas residues were marked as partially-functional if mutations mildly lowered yeast growth in comparison to WT. (b) The model-structure is colored by conservation, as in Fig. 2a. All positions which were sensitive-to-mutation are evolutionary conserved (grades 8 and 9), while all non-sensitive positions receive significantly lower conservation scores, as anticipated.

