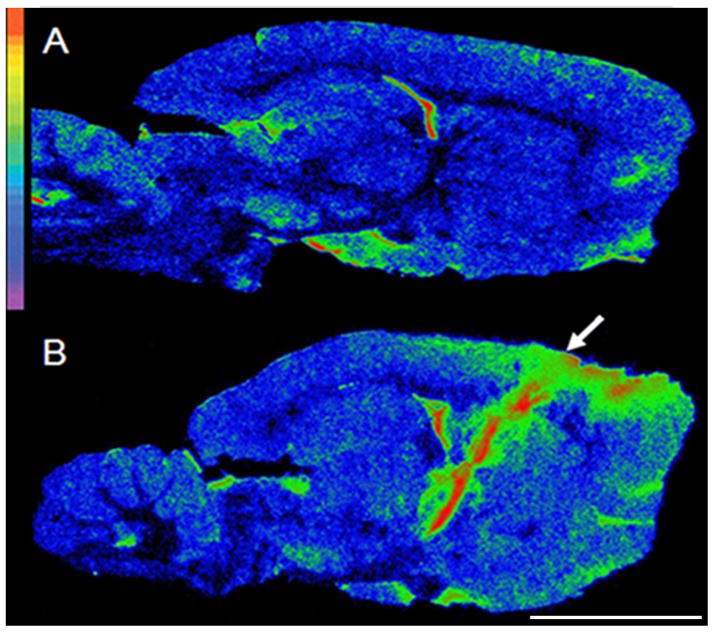
Figure 1.
Regional neuroinflammation at the level of the STN one week following electrode implantation. Autoradiograms of sagittal brain sections from: A= an intact animal, B= an animal implanted with thick electrodes. Autoradiograms were pseudocolored using the rainbow spectrum (top left) with red representing the highest value. The electrode insertion point is marked by an arrow. Scale bar: 0.5cm.

