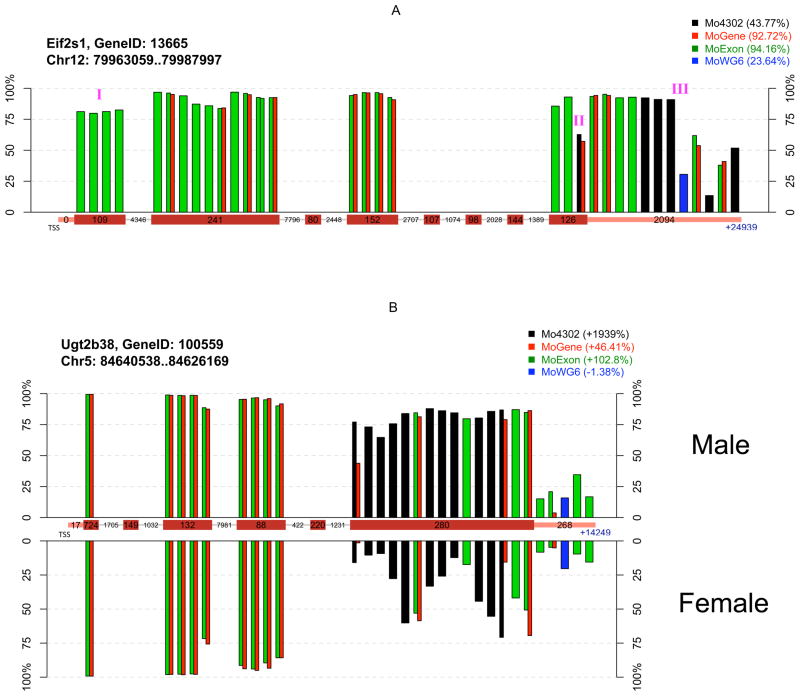
Figure 4. Interplatform comparison of probe-level expression measurements between sample groups.
Each bar represents individual probe(s) color-coded by platform at unique chromosomal locations, with bar height indicating probe-level measurement percentile. Probes common to multiple platforms are indicated by adjacent bars. Probes are ordered relative to their distance from the transcriptional start site (TSS), and packed into their corresponding gene segment indicated on the central x-axis (exon, intron, or 3′ UTR). Box width is not proportional to segment size, but numbers within each box indicate actual base number per segment. A) Absolute measurements at the probe set-level are highly variable among platforms due to differences in probe location and number. Legend indicates probe set-level average percentiles of four mouse samples on each platform. (I) These probes are located in a non-coding exon. (II) This probe is located at the exon-3′ UTR junction, with 14 bases in the last exon and 11 bases in the 3′ UTR. The measurements from this probe are considerably lower than those from nearby probes, suggesting an excision event. (III) The gap between these two probes is about 800 bases long, which separates the 3′ UTR into two parts. The first part of the UTR is highly conserved across species according to the UCSC genome browser, but the second part is not. B) Probe location and number impacts the relative change at the probe-set level between sample groups. Probe-level percentiles were plotted separately by sample gender. Legend indicates probe set-level change of two male samples relative to two female samples. Eif2s1 and Ug2b38 are examples of genes having highly different results by platforms. Their analysis is not suggested to indicate overall platform performance, as expression patterns may substantially differ under different experimental conditions. Additional probe-level plots are available as supplementary materials.

