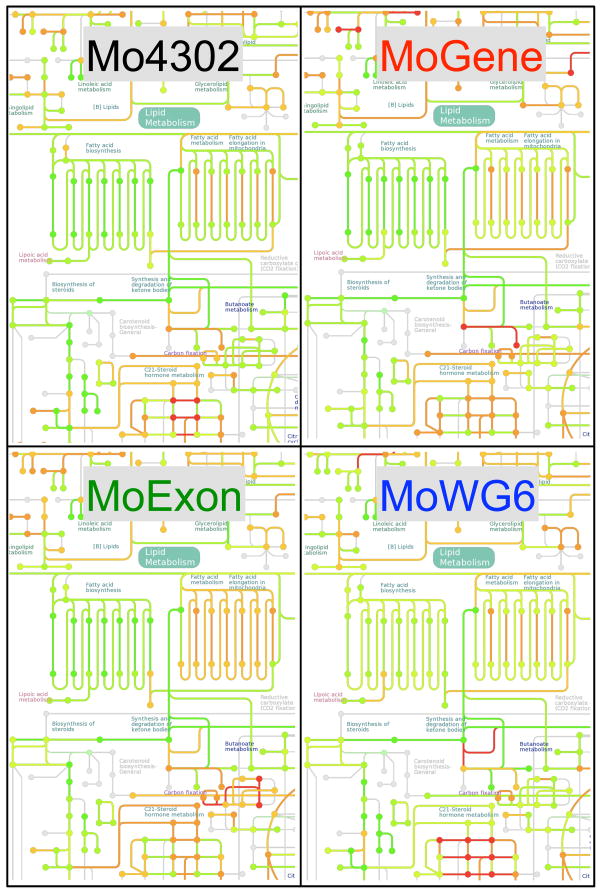
Figure 5. Interplatform comparison of pathway-level transcriptional response of lipid metabolism to Probucol treatment.
Kegg Atlas maps permit visualization of a subset of pathway-level expression changes in sample groups related to lipid metabolism (www.kegg.jp/kegg/atlas). All four expression pathways indicated Probucol therapy results in significant down-regulation of fatty acid biosynthesis. The complete metabolic pathway maps are available as supplementary materials. Map elements were colored red or green if the corresponding genes were up- or down-regulated by Probucol, respectively. The magnitude of change was coded in color scale. Unavailable elements were labeled gray.

