Figure 5.

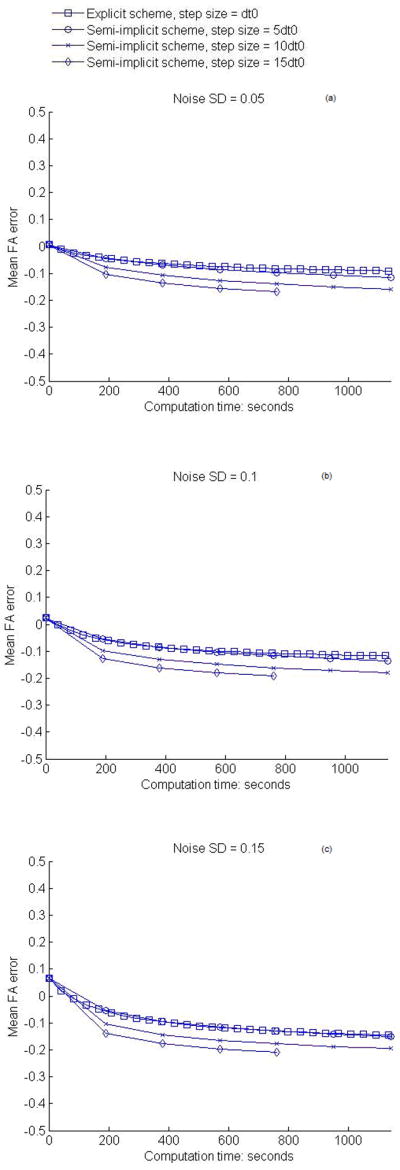
Variations of mean FA difference with computation time of smoothing. (a–c) show the results for the in vivo human data at the noise level SD = 0.05, 0.1, 0.15 respectively.

Variations of mean FA difference with computation time of smoothing. (a–c) show the results for the in vivo human data at the noise level SD = 0.05, 0.1, 0.15 respectively.