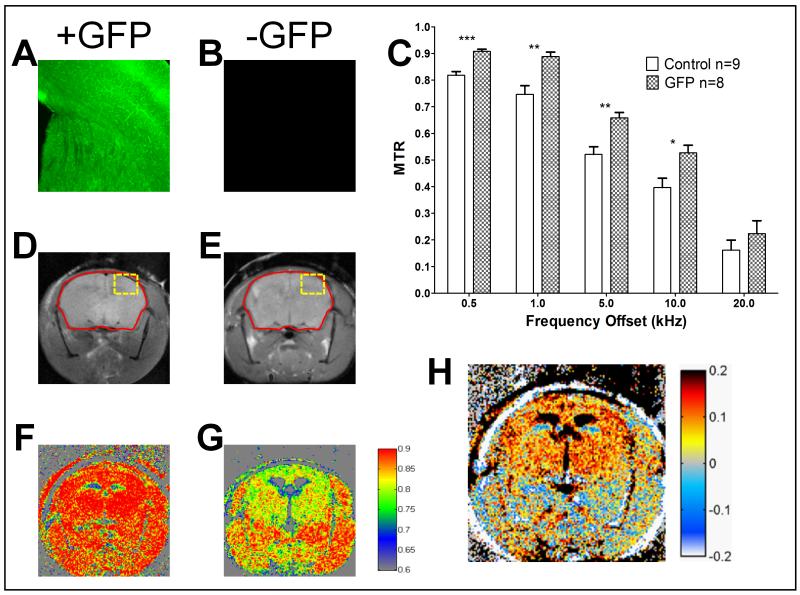
Figure 3.
Ubiquitous expression GFP mouse model. Panels A and B are representative fluorescence images of the cortex and midbrain from GFP expressing (A) versus control (B) mice. Control sample (B) does not give appreciable signal at the settings used for GFP positive animals. Panel C shows the region based MTR calculations for the different frequency offsets for GFP vs. Control. Significance was assessed with a mixed model ANOVA followed by linear contrasts for each offset frequency with ***p<0.001, **p<0.01 and * p<0.05 (p=0.0113). Panels D and E contain the unsaturated images from GFP (D) and control (E) mice. The red outline depicts the region of interest for Panel C. Panel F and G show the pseudocolored pixel by pixel MTR calculation for 1 kHz offset from GFP (F) and Control (G) mice. Panel H is the subtraction of the MTR images in the form of GFP positive minus GFP negative MTR.

