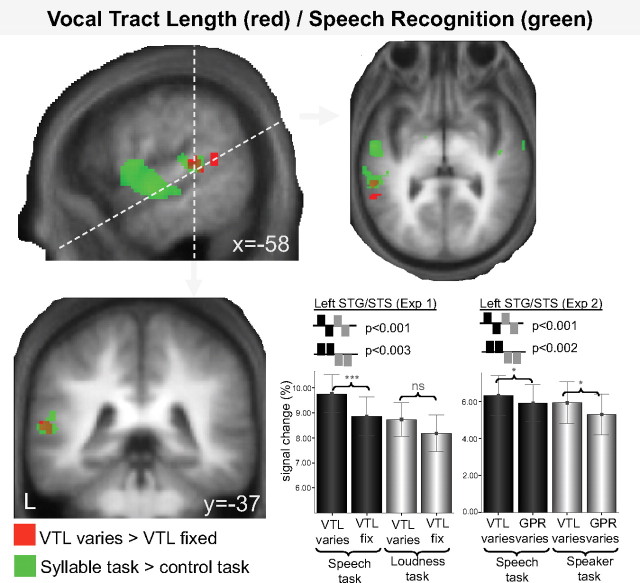
Figure 2.
BOLD responses associated with the main effect of VTL (red) and main effect of task (green) as revealed by the conjunction analysis of experiment 1 and experiment 2. The group mean structural image is overlaid with the statistical parametric maps for the respective contrasts. “Control task” refers to loudness task in experiment 1 and to speaker task in experiment 2. L, Left hemisphere; VTL, acoustic effect of vocal tract length. The dotted lines on the sagittal section indicate the slices displayed as horizontal and coronal sections. The plots show the parameter estimates for experiments 1 and 2 separately. The small bar graphs on top of the plots display the main effects and their significance threshold in a repeated-measures ANOVA. Results of post hoc t tests are indicated by the brackets within the plot. *p < 0.05, ***p < 0.001. ns, Nonsignificant. Error bars represent ±1 SEM.

