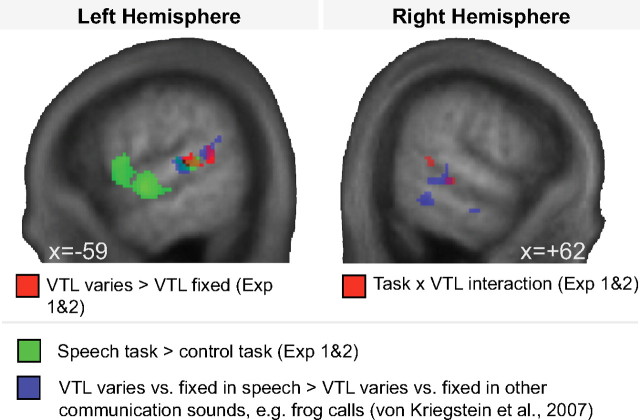
Figure 4.
Overview of BOLD responses in right and left hemisphere. This figure also includes the BOLD responses reported in a previous study (von Kriegstein et al., 2007). The right-sided activation for the previous study is shown at a threshold of p < 0.003 for display purposes. The voxel with the maximum statistic for this study is at (60, −42, −2), Z = 3.12.

