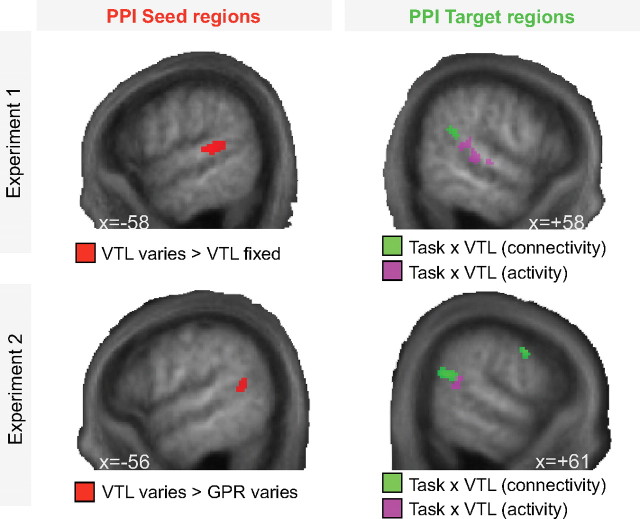
Figure 5.
Functional connectivity (PPI) between left and right posterior STG/STS. Seed regions were taken from individual subject clusters; here the group mean is shown (red). Target regions identified by the PPI analysis (VTL × task, connectivity) are shown in green [MNI coordinates: experiment 1, (58, −46, 20), Z = 3.03; experiment 2, (60, −52, 20), Z = 3.26)]. BOLD responses associated with the interaction between task and VTL (VTL × task, activity) are displayed to demonstrate their consistently close proximity to PPI target regions in right posterior STG/STS.

