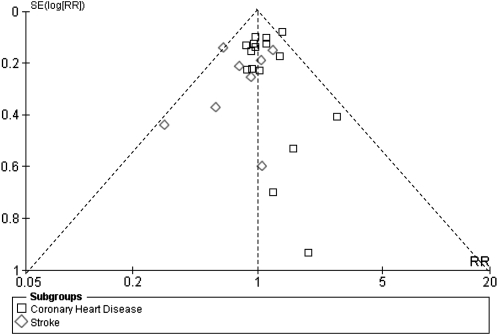
FIGURE 3.
Funnel plot of studies of saturated fat intake in relation to cardiovascular disease. Dotted lines are pseudo 95% CIs. The large studies at the top of the plot were somewhat more symmetrically distributed than the small studies at the bottom. This indicates publication bias favoring studies with significant results. RR, risk ratio.

