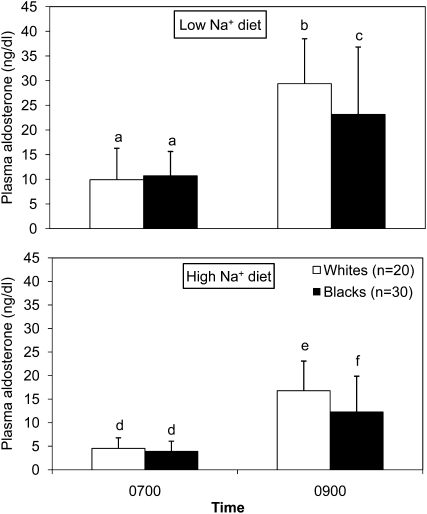
FIGURE 3.
Mean (±SD) plasma aldosterone concentrations in black and white girls at the end of the 3-wk study period on low- and high-sodium (Na+) diets. Blood samples were drawn at 0700 after subjects had been recumbent overnight and at 0900 after they had been upright for 2 h. Data points with different letters are significantly different (P < 0.05, ANOVA).

