
Figure 3. Representative northern blot analyses confirming changes in mRNA levels.
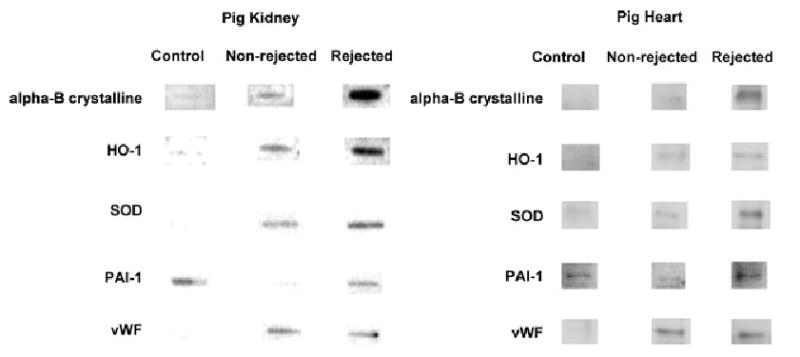
Total RNA samples (2 μg) from pig kidney and heart grafts and the respective nontransplanted control samples analyzed by the miniarrays, were also examined by northern blot analysis. Corresponding genes to the probes are identified to the left of the autoradiographs. See text for details (Abbreviations: Table 2).