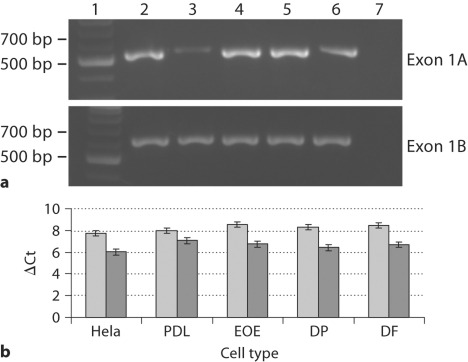
Fig. 2.
Expression of NFI-C exons 1A and 1B in dental and nondental tissues. a Detection of exon 1A and 1B in kidney (2), spleen (3), brain (4), heart (5) and liver (6); DNA ladder (1) and no DNA control (7). b Quantitative real-time PCR expression levels of exon 1A (light gray) and 1B (dark gray) in Hela, PDL, enamel organ epithelium (EOE), dental pulp (DP) and DF.

