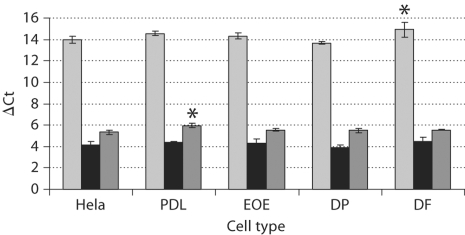
Fig. 4.
Quantitative analysis of NFI-C isoforms in dental and nondental cells. NFI-C1 (light gray), NFI-C2 (black) and NFI-C4 (dark gray) transcripts were measured using ΔCt which is inversely related to the transcript levels. * Significant differences of NFI-C1 in DF (p = 0.043) and NFI-C4 in PDL (p = 0.0042) compared to respective isoform expression in Hela cells. EOE = Enamel organ epithelium; DP = dental pulp.

