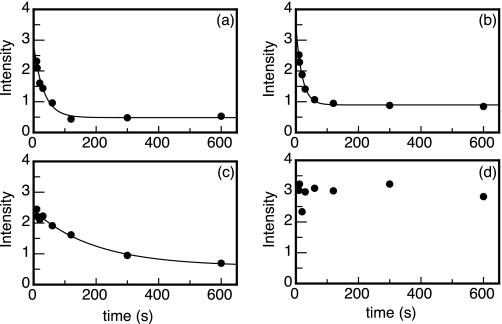
FIGURE 3.
Typical H/D exchange curves obtained for the molten globule folding intermediate of Tyr44-flavodoxin. Shown are time-dependent decreases of maximal intensities of cross-peaks arising from backbone amides of Ile3 (kex = 0.031 ± 0.009 s−1) (a), Ala18 (kex = 0.050 ± 0.016 s−1) (b), Leu50 (kex = 0.0051 ± 0.0023 s−1) (c), and Tyr114 (kex not determined) (d), respectively. Data are extracted from HSQC spectra like the ones shown in Fig. 2.

