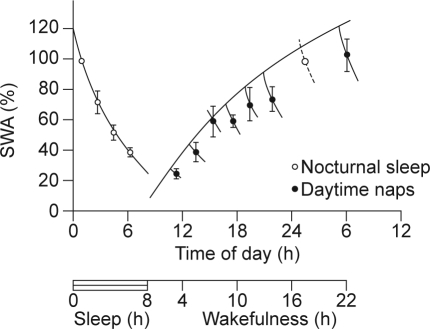
Figure 4.
Slow wave activity (SWA) in nonrapid eye movement (NREM) sleep during baseline sleep and in the first NREM sleep (open circles) and in the first NREM sleep episodes of naps (closed circles) starting at 10, 12, 14, 16, 18, 20, and 22 hours in seven healthy female subjects.33 Data are plotted at the midpoint of NREM–REM cycles. Note that the first value of baseline sleep is replotted at 24 hours. Vertical lines indicate the standard error of the mean. A saturating exponential function was fitted through the extrapolated values at sleep onset. This extrapolation was based on the duration of the NREM–REM cycle of the naps and the time constant of the exponential declining function fitted through the average values of SWA in NREM–REM cycles of baseline sleep. All values are expressed as percentages of the value of slow wave activity in the first NREM–REM cycle of baseline night sleep. Reproduced, with permission, from Dijk.33

