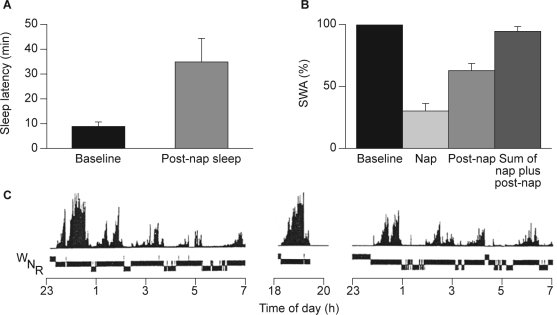
Figure 5.
A: Sleep propensity, B: slow wave activity (SWA) and C: time course of SWA and vigilance states (N, nonrapid eye movement sleep; R, rapid eye movement sleep; W, waking) of baseline night, nap and post-nap sleep after a nap in the early evening in a single subject. SWA was expressed as a percentage of total accumulated SWA in baseline sleep. Reproduced, with permission, from Werth et al.42

