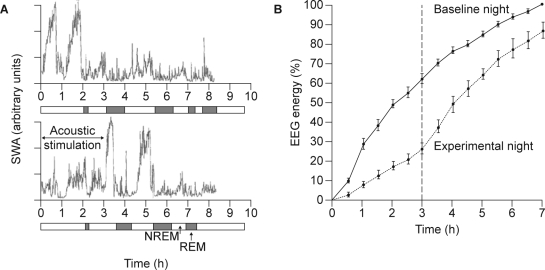
Figure 6.
Effect of repeated disruption of sleep on slow wave activity (SWA) in nine healthy subjects. A: Time course of SWA during baseline sleep (top) and during a sleep episode during which SWA was suppressed by acoustic stimulation (bottom).33 B: Accumulation of electroencephalogram (EEG) energy during baseline (solid line) and a sleep episode during which SWA was suppressed by acoustic stimulation (dotted line). Solid vertical lines indicate the standard errors of the means. Dashed vertical line indicates the end of slow wave sleep deprivation during the experimental night. Values are expressed as a % of energy accumulated during the first 7 hours of the baseline night.78 NREM, nonrapid eye movement; REM, rapid eye movement. Reproduced, with permission, from Dijk33 and Dijk et al.78

