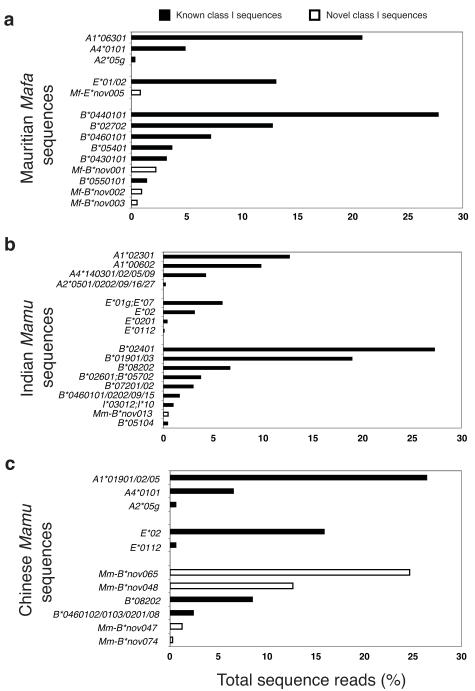
Figure 2. MHC class I transcript abundance profiles.
The frequency of each class I sequence is indicated as a percentage of the total MHC class I sequence reads that we evaluated for each animal. Open bars indicate MHC class I sequences that have not been described previously. Group specific designations such as Mafa-A2*05g indicate the large Mafa-A2*05-like family of sequences which differ by a few nucleotide substitutions outside exon two. (a) Mauritian cynomolgus macaque that is homozygous for the M1 haplotype22. (b) Indian rhesus macaque that is homozygous for the B24 haplotype17. (c) Chinese rhesus macaque that is homozygous for a novel Mamu-B haplotype and expresses several abundant Mamu-B sequences that have not been described previously.

