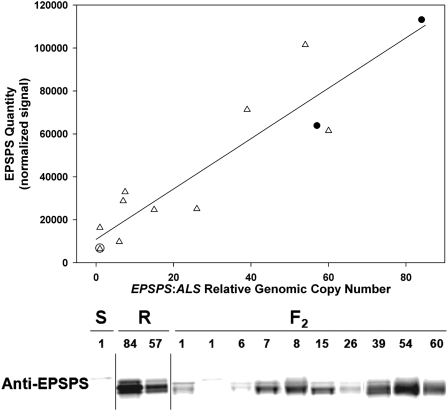
Fig. 4.
EPSPS protein levels in glyphosate-susceptible (S), glyphosate-resistant (R), and pseudo-F2 A. palmeri plants are correlated with relative EPSPS genomic copy number. Top: Regression of normalized EPSPS quantity on increase in relative EPSPS genomic copy number; open circles: S; filled circles: R; open triangles: F2. Bottom: Samples with <20 relative EPSPS copies had 30 μg TSP loaded per lane, and samples with >20 relative EPSPS copies had 15 μg TSP loaded per lane. Increase in relative EPSPS genomic copy number is indicated above each sample lane.

