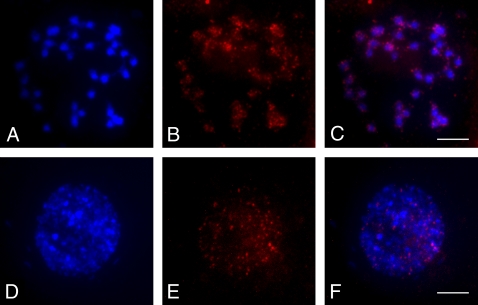
Fig. 6.
FISH mapping in an A. palmeri glyphosate-resistant individual. (A) Somatic metaphase chromosomes of glyphosate-resistant A. palmeri. (B) FISH signals from the EPSPS gene probe. (C) Merged image from A and B. Dispersed signals can be observed on every chromosome. (D) An interphase nucleus of glyphosate-resistant A. palmeri. (E) FISH signals from the EPSPS gene probe. (F) Merged image from D and E. (Scale bars, 5 μm.)

