Fig. 1.
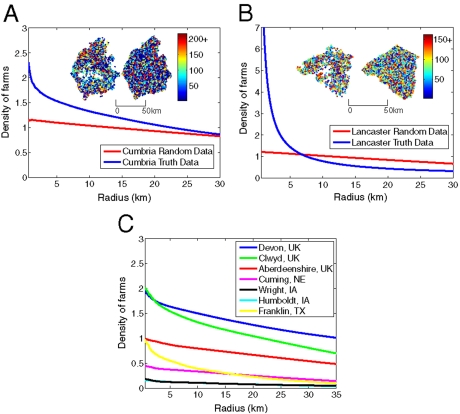
Graphs showing the average density of farms against radius around each farm as the radius varies for the true data (blue line) and random data (red line) in (A) Cumbria, UK and (B) Lancaster County, PA. Insets show farm locations for each respective county for the true data (left plot) and the random data (right plot). The color scale on the insets shows the number of cattle on each farm. (C) Average density of farms against radius around each farm for the true data for Devon, Aberdeenshire, and Clwyd in the United Kingdom and Cuming, Wright, Humboldt, and Franklin in the United States.

