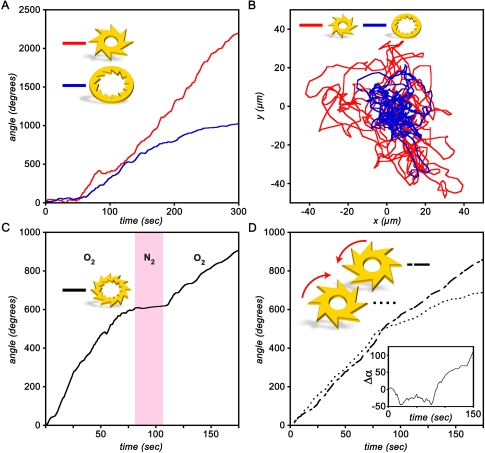
Fig. 3.
Quantification of gear performance. (A) Gear’s rotation. Typical plots of the rotation angle vs. time for two types of gears. (B) Random motion of the center of mass. Position of the gears’ center of mass for the data shown in (A). Gears fluctuate around the center of the film due to confinement caused by the gravitational depression of the film. (C) Speed control. Plot of the rotation angle as a function of time for a gear with both internal and external teeth. The gear rotates when bacteria are exposed to air or oxygen but halt (region shaded pink) when the chamber is filled with nitrogen. (D) Synchronous rotation. Rotation angle as a function of time for a system of two gears. For approximately the first 100 sec, the gears rotate in synchrony. The inset plots the difference Δα in the rotation angles. Movies S1 and S2 accompany data in (A) and (B), Movie S4 accompanies data in (C), and Movie S3 accompanies data in (D).

