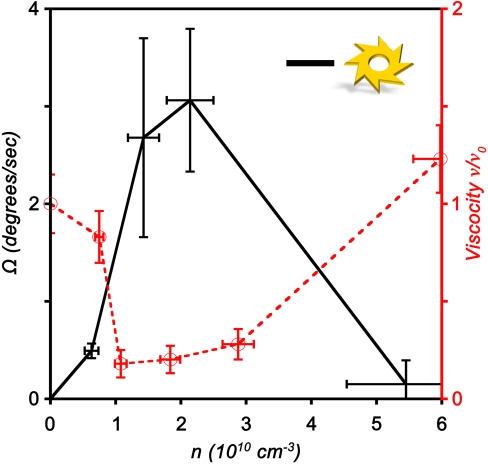
Fig. 4.
Concentration dependence. Black solid line has the dependence of the gear rotation rate on the concentration of bacteria, n. Vertical error bars represent standard deviations of the rotation rate with gears decorated with 8 outward teeth. Sharp increase in the rotation rate at concentration ∼1010 cm-3 coincides with the onset of collective motion. For concentration above 4 × 1010 cm-3 rotation ceases due to the decrease in bacterial motility (32). For comparison, the dependence of effective viscosity ν of bacterial suspension measured at the same conditions is plotted as a red dashed line (adopted from ref. 32); ν0 is viscosity of liquid without bacteria.

