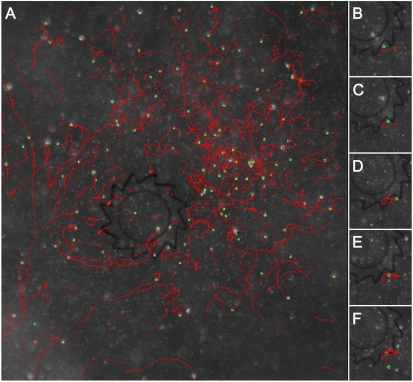
Fig. 5.
Tracer trajectories. Trajectories of 2.5 μm fluorescent tracers (green points) tracked in 180 consecutive frames (total tracking time 18 sec). Red curves represent reconstructed tracer trajectories (A). Trajectory of an individual tracer in the vicinity of gear’s tooth for 5 periods of time, t = 0,5,10,15,20 sec (B–F). The tracer spends significant amount of time trapped in the corner before it finally “escapes.” For all images, concentration of bacteria is 2 × 1010 cm-3. Movie S5 accompanies this figure.

