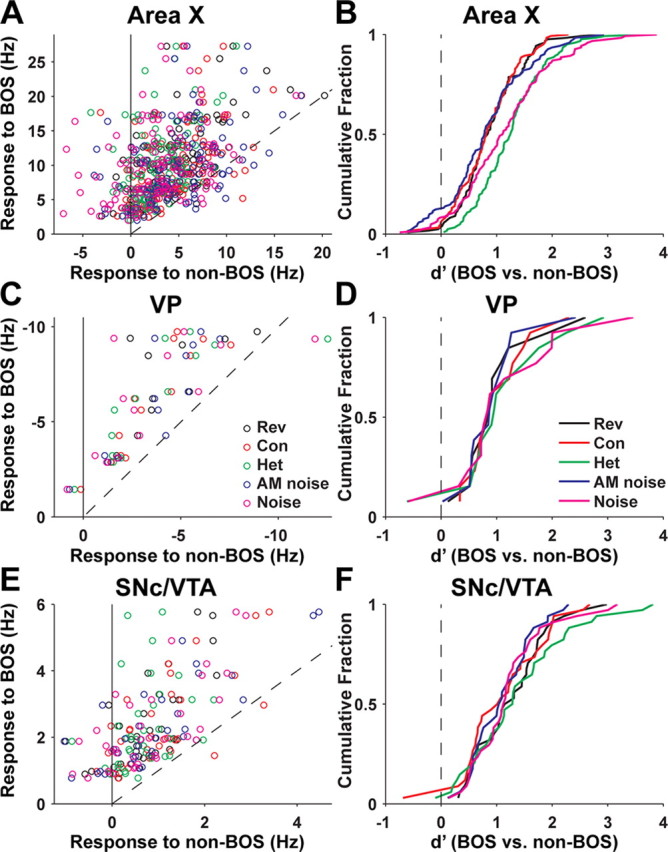
Figure 3.

Response strength and selectivity of all area X, VP, and SNc/VTA dopaminergic neurons recorded. A, For each area X neuron (n = 122 cells, 67 birds), mean response to BOS (y-axis) compared with the mean response to each of the five non-BOS stimuli (x-axis), which include reverse BOS (Rev; black circles), conspecific song (Con; red circles), heterospecific song (Het; green circles), amplitude-modulated noise (blue circles), and unmodulated noise (magenta circles), as indicated in C. Each cell contributes a row of five circles with the same y-axis value. The dashed line has slope unity. B, Cumulative probability distribution of d′ values (see Materials and Methods) for area X neurons comparing responses to BOS with responses to each of the non-BOS stimuli, indicated by different colored lines as labeled in D. C, Same as A for VP neurons (n = 13 cells, 7 birds). D, Same as B for VP neurons. Values of d′ for VP neurons were multiplied by −1 (see Materials and Methods). E, Same as A for SNc/VTA dopaminergic neurons (n = 34 cells, 18 birds). F, Same as B for SNc/VTA dopaminergic neurons.
