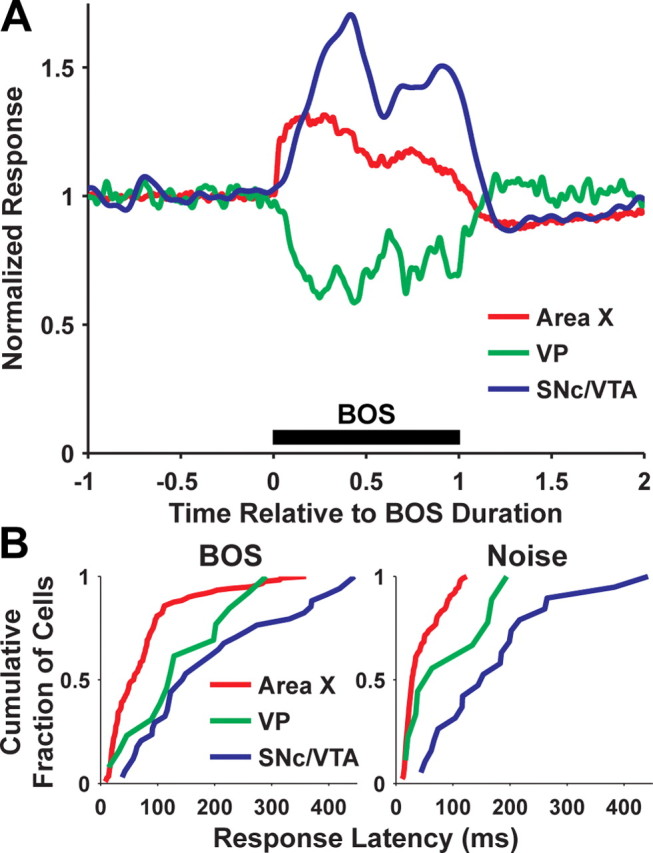
Figure 5.

Population response to BOS and response latency of area X, VP, and SNc/VTA dopaminergic neurons. A, Average firing rate (normalized to baseline) of area X (red), VP (green), and SNc/VTA dopaminergic neurons (blue) during BOS playback. Time is normalized to the duration of BOS (see Materials and Methods). B, Cumulative probability distribution of response latencies to BOS (left) for area X (n = 122), VP (n = 13), and SNc/VTA dopaminergic neurons (n = 34), or response latencies to noise (right; n = 97, area X; n = 9, VP; n = 19, SNc/VTA).
