Fig. 3.
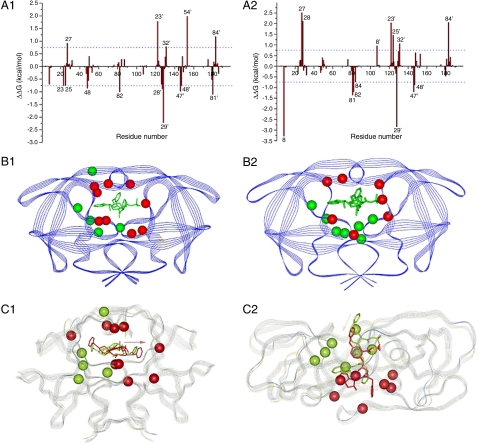
Energetic and structural insight of the resistance mechanism. A1: The difference between each residue’s contribution to the interaction with indinavir in (A1) the M46I/I54V and the M46I; (A2) the I54V/V82A and the V82A. ΔΔG was calculated by subtracting each residue’s interaction energy in the single mutant (e.g., M46I) from the double mutant (M46I/I54V). Residues with absolute value greater than 0.75 kcal/mol are labeled. Structural distributions of important residues in Fig 3 A1 and A2 are shown in B1 and B2, resp. The protease is shown in Blue Strand and indinavir in Green Stick. Residues with negative and positive ΔΔG’s, which represent residues contributing more and less favorably to binding with indinavir in the double mutant (e.g., M46I/I54V) than in the single mutant (e.g., M46I) resp., are shown in Red and Green CPK models, resp. The favorable residues to the binding of indinavir to the M46I/54V mutant are shown as the Red CPK model and those of the unfavorable residues as the Green CPK model. Alignment of the average structure of the double and single mutant complexes (C1) between M46I/54V and M46I mutated; (C2) between I54V/V82A and V82A. The average structure was obtained by averaging the 125 snapshots taken from 0.5–3.0 ns MD simulations. The double (e.g., M46I/I54V) and single (e.g., M46I) protease mutants are shown in Blue and Green strands, resp. Indinavirs bound to the double (e.g., M46I/I54V) and single (e.g., M46I) are shown in Red and Green Sticks, resp. The Pink Arrow shows the configurational change of indinavir in the two complexes. The cooperation between, for example, V54 and A82 significantly changes the active site’s conformation that further enhances resistance caused by the mutation at position 82 alone. The conformational change is manifested in the alignment of the average structures of the double (e.g., I54V/V82A) and single (e.g., V82A) mutant complexes.

