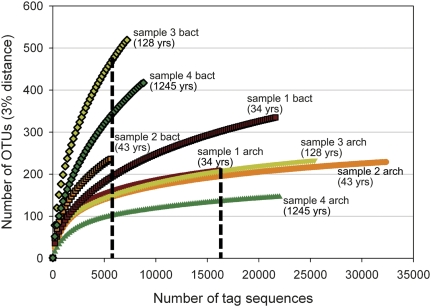
Fig. 2.
Rarefaction analysis of archaeal and bacterial V6 tag sequences for each of the four chimney samples. OTUs, operational taxonomic units defined by clustering sequences with a 3% pairwise distance threshold. Bacterial diversity (curves outlined in black) is clearly greater than archaeal diversity in all samples. Rarefaction curves for archaeal sequences are near-asymptotic, indicating nearly complete sampling of archaeal V6 amplicon libraries. Dashed line indicates the point to which data were subsampled to compare diversity values among samples in Table 1.

