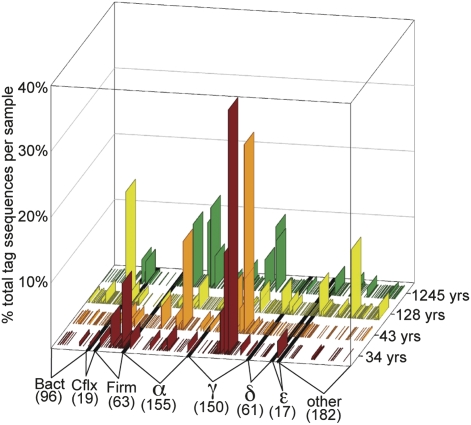
Fig. 4.
Relative abundance distribution of bacterial OTUs among samples. OTUs are labeled according to their taxonomic assignment by the GAST process (22). α, Alphaproteobacteria; Bact, Bacteroides; Cflx, Chloroflexus; δ, Deltaproteobacteria; ε, Epsilonproteobacteria; Firm, Firmicutes; γ, Gammaproteobacteria.

