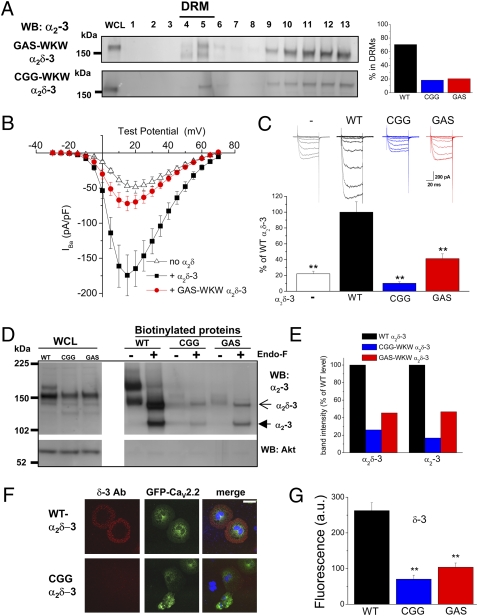
Fig. 2.
Evidence that GPI-anchoring of α2δ-3 is required for cell-surface localization and function. (A Left) Immunoblot profile of GAS-WKW α2δ-3 (Upper) and CGG-WKW α2δ-3 (Lower) in DRM fractions from transfected tsA-201 cells using α2-3 (71–90) Ab. (Right) Bar chart showing the average proportion of the total α2δ-3 found to be in DRM (sucrose gradient fractions 4–6) for WT α2δ-3 (black bar), CGG-WKW α2δ-3 (blue bar), and GAS-WKW α2δ-3 (red bar) from two independent experiments each. (B) Mean I-V relationship for CaV2.2/β1b coexpressed with WT α2δ-3 (▪ n = 12), with GAS-WKW α2δ-3 (red • n = 25), or without α2δ (△ n = 23) in tsA-201 cells. All recordings are in 5 mM Ba2+. (C) Peak IBa (mean ± SEM) measured at +15 mV was determined from I-V relationships including those in A. CaV2.2/β1b is shown without α2δ (white bar; n = 36), with WT α2δ-3 (black bar; n = 16), with CGG-WKW α2δ-3 (blue bar; n = 22), or with GAS-WKW α2δ-3 (red bar; n = 25). Data were pooled from several experiments and normalized to the respective control (+WT α2δ-3) in each experiment. The statistical significances of the differences compared to +WT α2δ-3 were determined by ANOVA and post hoc Bonferroni test. **, P < 0.001. Example IBa currents (from −30 mV to +15 mV from a holding potential of −90 mV) are shown above the bars for no α2δ (gray), WT α2δ-3 (black), CGG-WKW α2δ-3 (blue), and GAS-WKW α2δ-3 (red). (D Upper) Cell-surface biotinylation of α2δ-3 (WT), CGG-WKW α2δ-3 and GAS-WKW α2δ-3. The left three lanes show WCL, and the right six lanes show WT and mutant α2δ-3 after cell-surface biotinylation, before and after deglycosylation with EndoF as indicated. Open arrow, full-length α2δ-3; closed arrow, cleaved α2-3. Lower shows lack of biotinylation of cytoplasmic Akt. (E) Quantification of relative amounts of full-length α2δ-3 and cleaved α2-3 for the CGG-WKW α2δ-3 (blue) and GAS-WKW α2δ-3 (red) mutants at the cell surface from two experiments, including the data shown in C, that were normalized to the amount in the WCL. (F) Confocal microscopic images showing membrane localization of α2δ-3 using the δ-3 Ab (Left, red) for WT (Upper) and CGG-WKW α2δ-3 (Lower) when coexpressed with green fluorescent protein CaV2.2 (Middle) and β1b in nonpermeabilized Cos-7 cells. (Right) Merged images show nuclear staining with DAPI (blue). Note that cell-surface staining in nonpermeabilized Cos-7 cells is seen, not as a fine ring but as a wide annulus, because of the flattened geometry (see also Fig. S3A). (Scale bar: 50 μm on merged images.) (G) Quantification of cell-surface immunofluorescence using δ-3 Ab for WT α2δ-3 (black bars; n = 68), CGG-WKW α2δ-3 (blue bars; n = 38), and GAS-WKW α2δ-3 (red bars; n = 38). Statistical significance is P < 0.001 for one-way ANOVA and Tukey’s post hoc tests.

