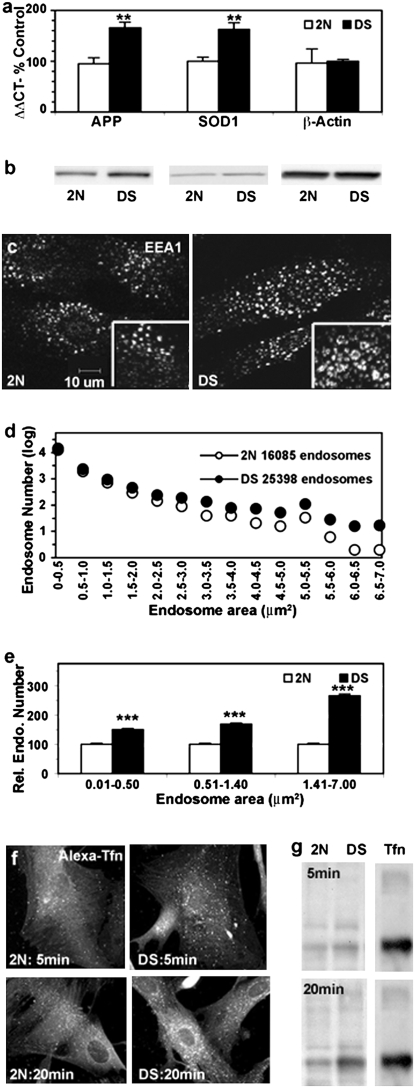
Fig. 1.
Assessment of DS fibroblasts (n = 5) compared with age-matched control samples (n = 5). (A) Expression levels of APP, SOD1, and α-actin in 2N and DS fibroblasts were determined by real-time qPCR (see Materials and Methods). **, P < 0.01. (B) Representative Western blot analysis of APP and SOD1 expression in DS and 2N fibroblasts. (C) Immunofluorescence images showing EEA1-labeled early endosomes in representative 2N and DS fibroblasts, with high magnification image shown in Inset. (D and E) The sizes of EEA1-positive vesicles in DS and 2N fibroblasts were counted with Image J, calculated, and graphed. Shown are the total number of EEA1-positive endosomes from 4 DS and 4 2N fibroblast lines and their distributions according to size (D) and the relative numbers of endosomes of different size ranges (E; mean ± SEM, n = 84; ***, P < 0.001.). Immunolabeling (F) and Western blot analysis (G) showing transferrin uptake by 2N and DS fibroblast at 5 and 20 min.

