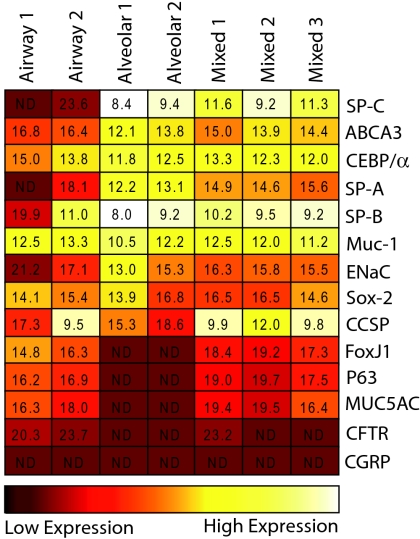
Fig. 5.
Multilineage differentiation of mixed lung epithelial cfus. Heat map shows relative real-time RT-PCR gene expression levels in cells harvested from single airway, alveolar, and mixed epithelial colonies. Values represent average ΔCt values of genes relative to 18s RNA control. ND, not detected (Ct <40).

