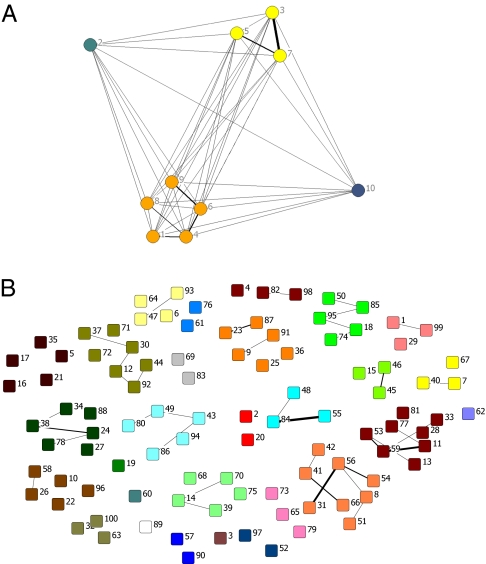
Fig. 2.
The quasicompartmentalization of the  matrices of molecular repertoires (A)
  and (B)
  . Nodes marked with the same color belong to the same quasicompartment. The widths of links correspond to the interaction strength. For the large
  matrix (B), only interactions stronger than
  are shown for simplicity. Quasicompartments are formed where the few large
  values from a log-normal distribution fall. The figure was drawn using NetDraw (42).

