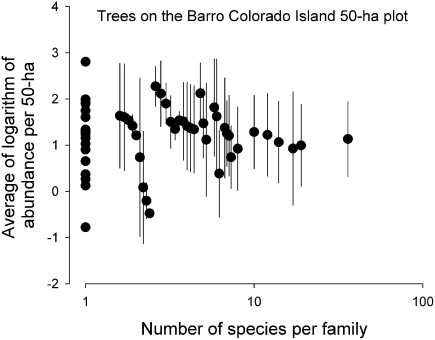
Fig. 5.
Average abundances of species of trees within family-level taxa on the 50-ha forest dynamics plot on Barro Colorado Island, Panama, based on the average number of individuals for each of 250 species in six 5-year censuses. Families with the same number of species are separated slightly to show the standard deviations of abundance among species. (Data from https://ctfs.arnarb.harvard.edu/webatlas/datasets/bci/abundance/bciN100.html.) Neither the family mean abundance (F 1,54 = 0, P = 0.95) nor the SD of abundance within families (F 1,34 = 1.35, P = 0.25) was related to the number of species per family.

