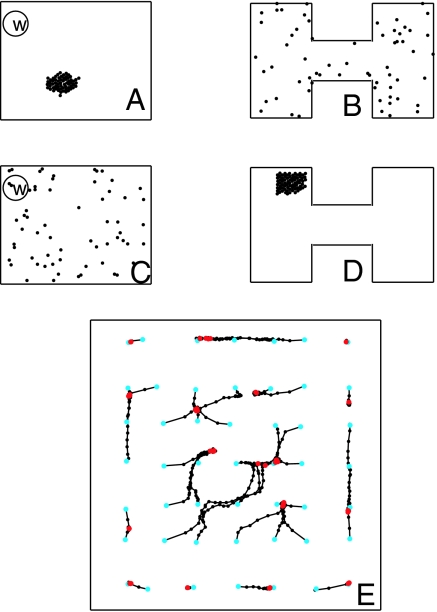
Fig. 2.
Activity bumps and bump motions. (A) Locations of strongly active place cells (dots) arrayed for environment R when the RR is at a particular location in R. (B) The same activity state as in A but with cells arranged according to their positions in environment H. (C) Same state as shown in D, but neurons are arranged according to their place fields in R. (D) A clump of strongly active neurons when the RR is in H and the cells are arrayed according to their positions in H. (E) Trajectories of the center of gravity of the bump location when started at 49 different spatial points (cyan dots) in R. Black dots are located at 0.2-s intervals. Motions are followed for 10 s. Red dots are final states.

