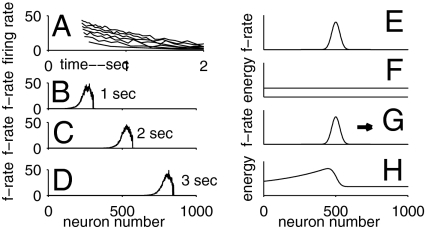
Fig. 3.
Adaptation and its consequences. (A) Firing rates of an adapting neuron as a function of time for step input currents of various sizes beginning at 0.4 s. (B–D) Snapshots of the firing rates of a line of neurons with spike-frequency adaptation, with synaptic connections for a line attractor. (E) A stable state bump of activity for the line attractor system with nonadapting neurons. (F) The energy of the system as a function of the location of the bump. (G) With adaptation, the bump moves in either direction with constant velocity, to the right in this example. (H) The frozen energy of the system as a function of bump location, defined by freezing the adaptation when the moving bump is at the location shown in G.

