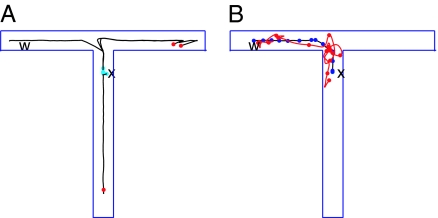
Fig. 6.
From mental exploration to physical performance. (A) The location of the center of the activity bump (solid line) when the activity was initiated at x. Red dots are ends of trajectories from which the activity bump jumped back to a location near x (cyan dots) and reinitiated an exploration. (B) The motion of the bump (blue line) and of the position of the RR (red line) after learning. Dots are spaced at 0.4-s intervals. The jagged real-space trajectory has been smoothed to facilitate clear presentation in this small-scale figure.

