
Figure 4.
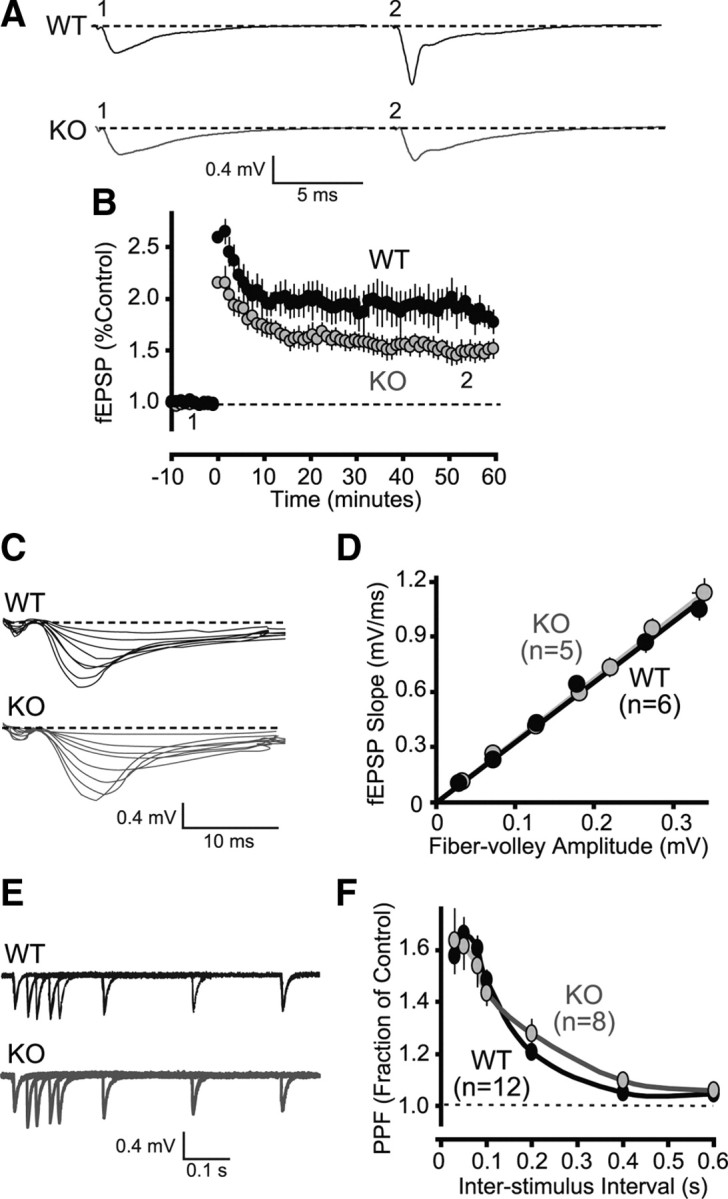
Decreased theta burst-induced LTP in area CA1 of NL1 KO mice. A, Representative traces showing fEPSPs from a WT and a KO animal before (1) and after (2) LTP induction by TBS. B, Time course of fEPSPs before and after LTP induction by TBS in WT (n = 6) and KO (n = 6) animals. The time points of the representative traces in A are noted on the graph (see 1 and 2). C, AMPA-mediated synaptic strength is unchanged in NL1 KO mice. Representative traces from a WT and a KO animal show input–output measurements with increasing stimulus intensities. Responses were measured in area CA1 of mouse hippocampus. D, Average fEPSP slope plotted against fiber-volley amplitude. Input–output measurements were performed in wild-type (n = 6) and KO (n = 5) animals. E, Overlaid representative traces from a WT and a KO animal showing paired-pulse facilitation of excitatory synaptic responses at interstimulus intervals ranging from 30 to 600 ms. F, Average paired-pulse facilitation of excitatory synaptic responses did not show any difference between WT (n = 12) and KO (n = 8) animals. Data plotted as means ± SEM.