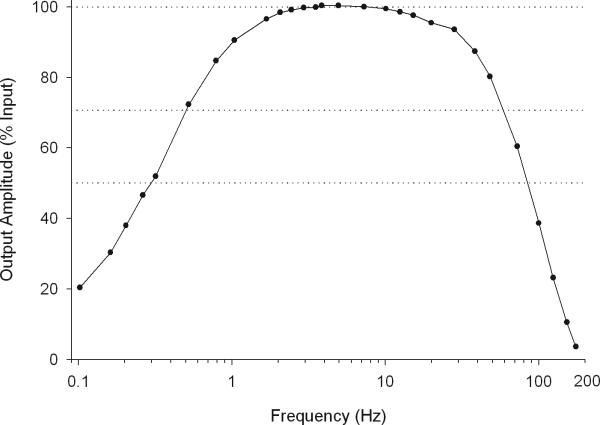
Figure 4.
Frequency-response curve for the hardware low frequency and high frequency filters on the Grass-Telefactor H2O ambulatory EEG recorder. Output amplitude as a percent of input amplitude is plotted against frequency (on a logarithmic scale). Signals between 2 and 13 Hz are largely unaffected (<2% decrease) by the filters. The low-frequency filter is a 0.3 Hz ½ amplitude filter with a 6-dB per octave roll off. A 0.5-Hz signal is decreased by ~30%; a 0.3-Hz signal is decreased by ~50 %. The high frequency filter decreases a 50 Hz signal by ~20% and a 100Hz signal by ~60%.

