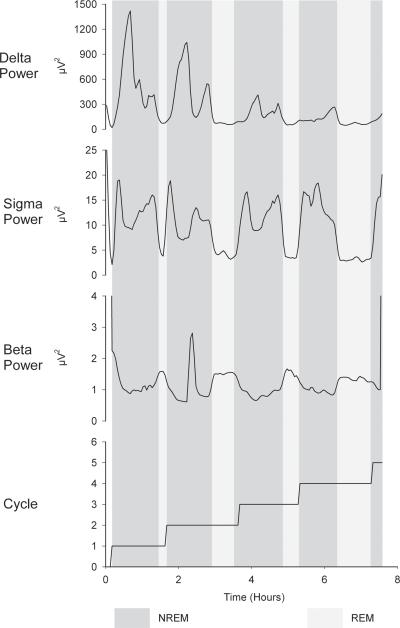
Figure 6.
All-night smoothed traces of analyzed EEG in three frequency bands. Dark background shading indicates NREM sleep; light background shading indicates REM sleep. Sleep cycle number is plotted on the bottom panel. Delta (1-4 Hz) power is high during NREM sleep and low during REM sleep. Sigma (12-15 Hz) power is also high during NREM and low during REM, but during NREM it fluctuates reciprocally with delta, being high when delta is low and low when delta is high. Beta (23-30 Hz) power is higher in REM than in NREM, with the exception of an artifactual peak during cycle 2.

