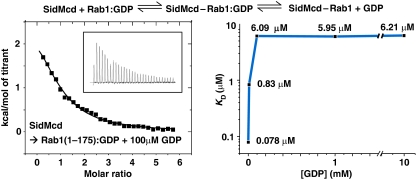
Figure 6.
Measurement of the binding affinity between SidMcd and Rab1(1-175) with GDP retained. ITC was performed with increasing concentration of GDP, which should suppress the release of GDP in the two-step reaction shown at the top. The protein samples were prepared in a buffer solution containing 20 mM Tris−HCl (pH 7.5), 100 mM NaCl and 1 mM MgCl2. A representative ITC run is shown and the Kd values measured at the different GDP concentrations are shown on the plot.

