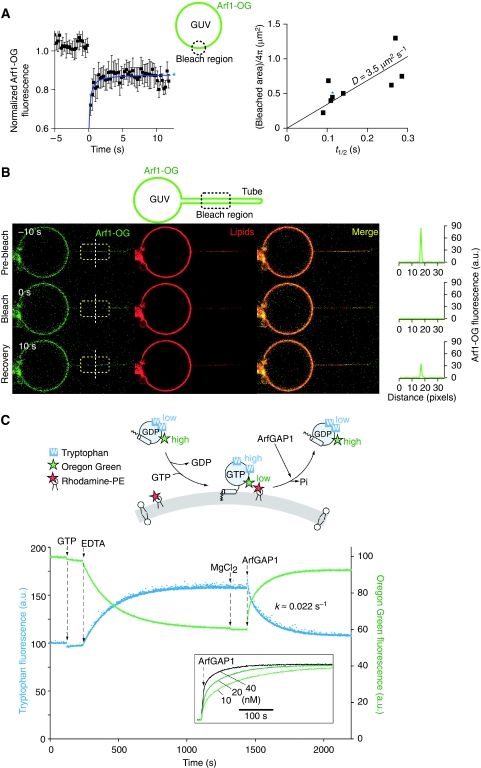
Figure 5.
Diffusion coefficient of Arf1-OG and rate constant of ArfGAP1-catalysed GTP hydrolysis on model DOPC membranes. (A) Left: typical FRAP curve for GTP-bound Arf1-OG on a DOPC giant vesicle. Right: correlation between the half time of recovery (t1/2) and the bleached area (πR2). The diffusion coefficient is given by D=R2/(4t1/2). (B) FRAP experiment showing the fast mobility of GTP-bound Arf1-OG on a DOPC tube pulled by optical tweezers. The length of the photobleached area is 12 μm. (C) Top: cartoon representation of the fluorescence signals used to follow either the conformational changes of Arf1-OG on nucleotide exchange and GTP hydrolysis or its binding to and dissociation from small DOPC liposomes. Bottom: Arf1-OG (0.5 μM) was mixed with DOPC small liposomes (0.4 mM; hydrodynamic radius=40±10 nm) containing 1 mol% Rhodamine-PE. At the indicated times, GTP (40 μM), EDTA (2 mM), MgCl2 (2 mM) and ArfGAP1 (10 nM) were added. Tryptophan fluorescence (blue trace) or Oregon Green fluorescence (green trace) was followed in real time. Note the good time correlation between the two recordings. The inset shows the time course of Arf1-OG dissociation as monitored by Oregon Green fluorescence using increasing concentrations of ArfGAP1.

