Figure 3.
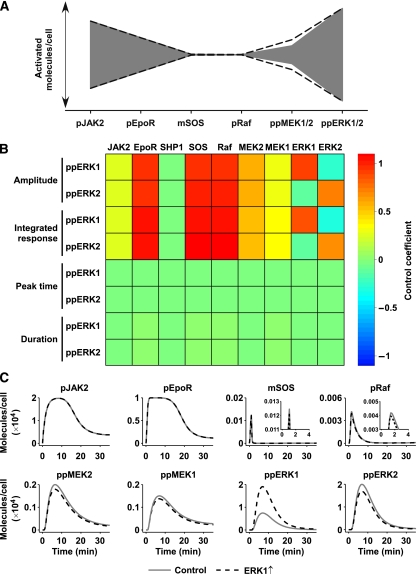
Sensitivity analysis shows isoform repression by negative feedback and signal amplification. (A) Bow-tie architecture of the signalling network. Abundance of activated molecules is shown in grey; standard deviations of the model predictions are indicated as dashed solid lines. (B) Control coefficients of the initial protein concentrations for amplitude, integrated response, peak time, and duration of double-phosphorylated ERK1 and ERK2 were calculated. Positive control is indicated by shades of red; negative control is shown by shades of blue, whereas green fields represent no control. (C) The impact of over-expressing ERK1 on the activation of upstream molecules by the negative feedback. Elevated ERK1 levels enhance the negative feedback on membrane-associated SOS. The slight reduction in activation of SOS and Raf (see insets) is propagated and amplified to MEK and ERK, thus reducing double-phosphorylated ERK2 levels.

