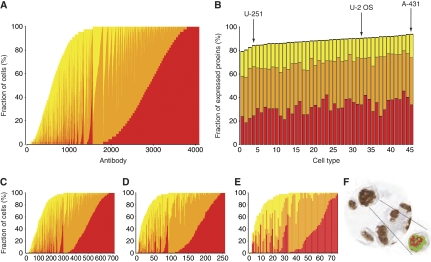
Figure 3.
Global protein expression in 45 human cell lines. (A) The fraction (%) of the 45 cell lines in which a particular protein was detected, including the fraction of the three relative expression levels: strong (red), moderate (orange), and weak (yellow). Each bar represents one of the 4096 antibodies with no missing data, i.e., where all cell lines were represented. (B) The fraction (%) of a total number of 5349 antibodies against 4349 proteins detected in a specific cell line, and with the cell lines ordered according to the fraction of proteins detected. The corresponding name and number of each cell line is shown in Supplementary Table S3 and the results for the various subfractions of antibodies are presented in Supplementary Figure S9. The same three staining categories were used and the black (top) part of the bar represents antibodies with missing data for the particular cell line. Arrows point out the three cell lines used in immunofluorescence analysis. (C) The fraction of cell lines in which each protein from a data set of 714 antibodies with supportive results from western blot analysis was detected. (D) A plot similar to C, with each bar representing one of the 257 antibodies remaining from a data set of paired HPA-antibodies, i.e., toward the same target protein, with no missing data for any of the cell lines, and a correlation coefficient of ⩾0.5 when cell line expression profiles were analyzed. (E) Same as D, but displaying only the results from the 75 antibodies with a correlation coefficient of ⩾0.8 and no missing data. (F) An example of cells, visualizing the interpretation of immunostaining by an automated image analysis software.

