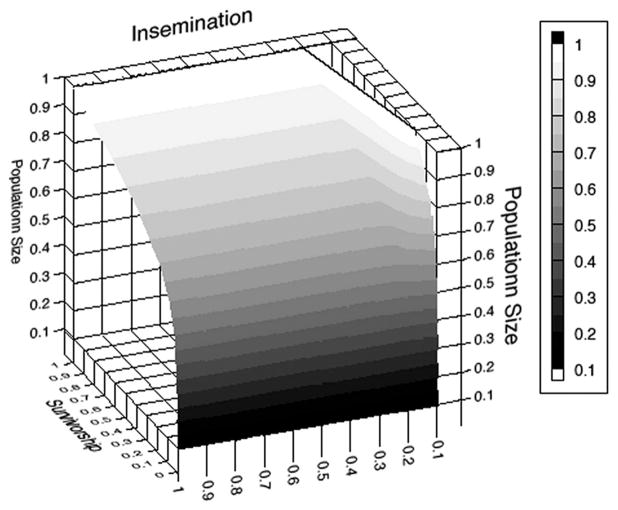
Fig. 9.
Population size after 183 d at different levels of reduced male insemination rate and survival, expressed as a proportion of population size after 183 d when sugar is readily available, under the assumption that both males and females are affected by a lack of carbohydrates in the environment.

