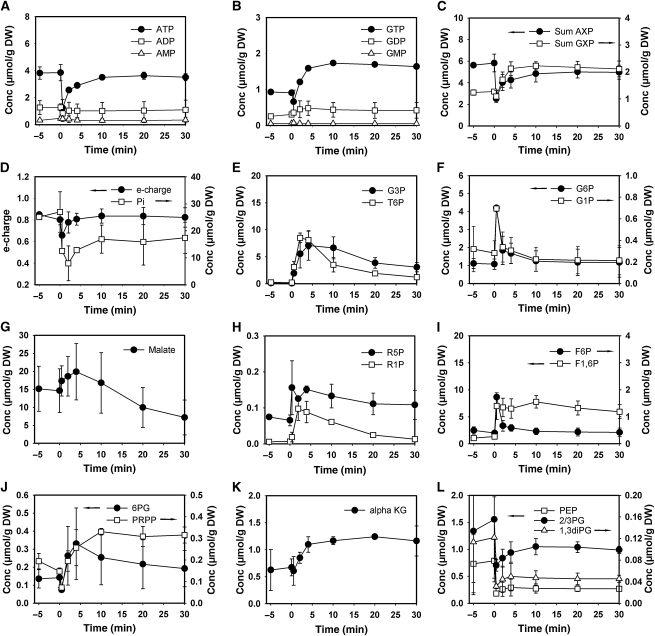
Figure 1.
Intracellular concentrations of glycolytic, TCA cycle, and pentose phosphate pathway metabolites after exposure of trehalose-grown wild-type cells to sudden increase of glucose concentration to 110 mmol/l. (A) ATP, ADP, and AMP; (B) GTP, GDP, and GMP; (C) sum of adenine and guanine nucleotides; (D) energy charge, inorganic phosphate (Pi); (E) glycerol-3-phosphate (G3P); trehalose-6-phosphate (T6P); (F) glucose-6-phosphate (G6P); glucose-1-phosphate (G1P); (G) malate; (H) ribose-5-phosphate (R5P); ribose-1-phosphate (R1P); (I) fructose-6-phosphate (F6P); fructose-1,6-bisphosphate (F1,6P); (J) 6-phosphogluconate (6PG); phosphoribosyl pyrophosphate (PRPP); (K) alpha-ketoglutarate (alphaKG); (L) phosphoenolpyruvate (PEP); pooled 2 and 3-phosphoglycerate (2/3PG); 1,3-phosphodiglycerate (1,3diPG). Data shown represent the average of at least two independent experiments. Metabolite concentrations are provided in tabular form in Supplementary information II.

