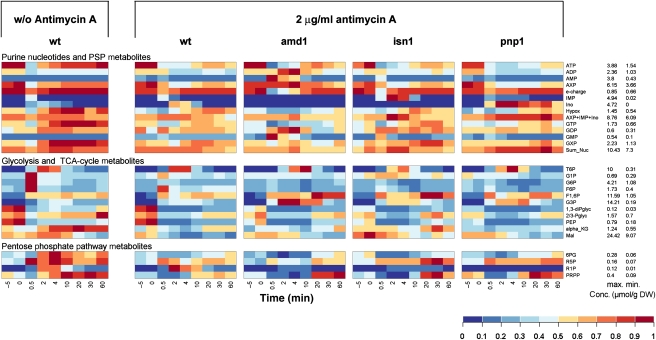
Figure 6.
Intracellular metabolite concentrations in trehalose-grown wild-type, amd1, isn1, and pnp1 mutant strains after a sudden increase in glucose concentration to 110 mmol/l in the presence of 2 μg/ml antimycin A. Antimycin A was added 1.5 min before glucose. The left panel shows intracellular concentrations for the WT strain in the absence of antimycin A as a reference. Metabolite concentrations were normalized to the highest concentration measured in all mutants over all time points. Actual concentrations corresponding to maximum and minimum values are shown on the right of the figure. Data represent the average of at least two independent experiments. Metabolite concentrations are provided in tabular form in Supplementary information II.

