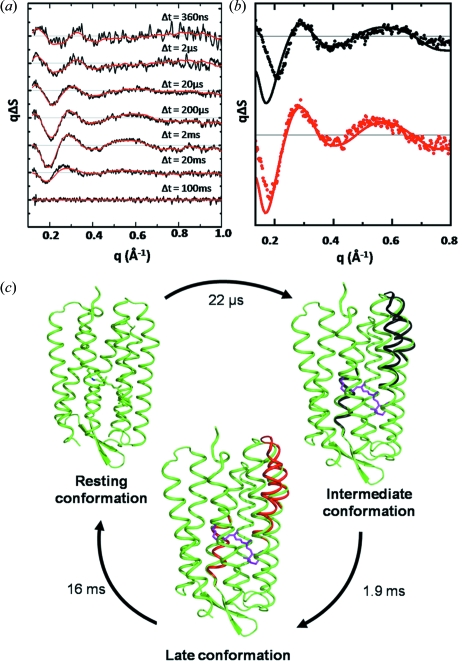
Figure 5.
Time-resolved wide-angle X-ray scattering data from solubilized samples of bacteriorhodopsin. (a) Integration in rings and subtraction of ‘laser off’ images from ‘laser on’ images yields the difference scattering curves as a function of the time delay (Δt) between photoactivation and the X-ray probe. (b) Basis spectra of an intermediate and late conformational state extracted from spectral decomposition of the data shown in (a). (c) Structural interpretation of these data using a rigid-body minimization routine illustrated in terms of the bacteriorhodopsin photocycle (Andersson et al., 2009 ▶). Reproduced from Structure (Andersson et al., 2009 ▶), copyright (2009), with permission from Elsevier.

